How Exploratory Data Analysis (EDA) Can Improve Your Data Understanding Capability
Can EDA help to make my phone upgrade decision more precise?

You may have heard the term Exploratory Data Analysis (or EDA for short) and wondered what EDA is all about. Recently, one of the Sales team members at TL Consulting Group were thinking of buying a new phone but they were overwhelmed by the many options and they needed to make a decision suited best to their work needs, i.e. Wait for the new iPhone or make an upgrade on the current Android phone. There can be no disagreement on the fact that doing so left them perplexed and with a number of questions that needed to be addressed before making a choice. What was the specification of the new phone and how was that phone better than their current mobile phone? To help enable curiosity and decision-making, they visited YouTube to view the new iPhone trailer and also learned more about the new iPhone via user ratings and reviews from YouTube and other websites. Then they came and asked us how we would approach it from a Data Analytics perspective in theory.
And our response was, whatever investigating measures they had already taken before making the decision, this is nothing more but what ML Engineers/data analysts in their lingo call ‘Exploratory Data Analysis’.
What is Exploratory Data Analysis?
In an automated data pipeline, exploratory data analysis (EDA) entails using data visualisation and statistical tools to acquire insights and knowledge from the data as it travels through the pipeline. At each level of the pipeline, the goal is to find patterns, trends, anomalies, and potential concerns in the data.
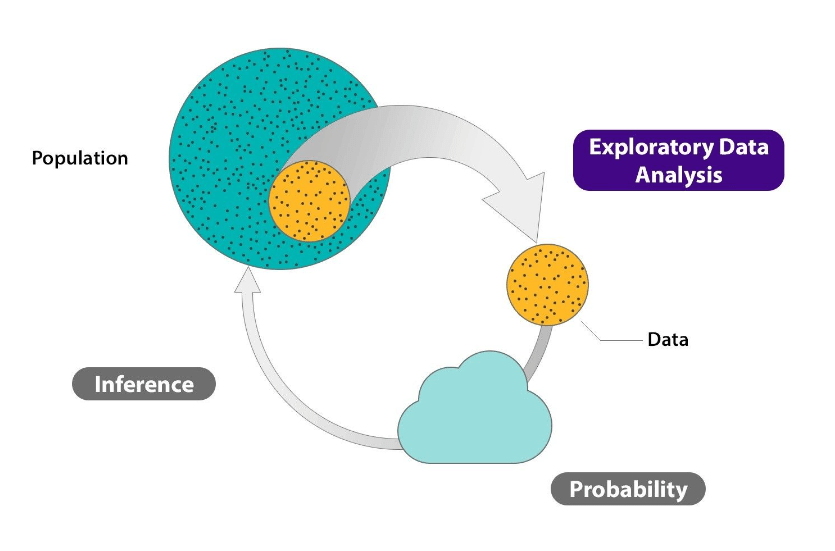
Exploratory Data Analysis Lifecycle
To interpret the diagram and the iPhone scenario in mind, you can think of all brand-new iPhones as a “population” and to make its review, the reviewers will take some iPhones from the market which you can say is a “sample”. The reviewers will then experiment with that phone and will apply different mathematical calculations to define the “probability” if that phone is worth buying or not. It will also help to define all the good and bad properties of the new iPhone which is called “Inference “. Finally, all these outcomes will help potential customers to make their decision with confidence.
Benefits of Exploratory Data Analysis
The main idea of exploratory data analysis is “Garbage in, Perform Exploratory Data Analysis, possibly Garbage out.” By conducting EDA, it is possible to turn an almost usable dataset into a completely usable dataset. It includes:
- Extracting important variables and leaving behind useless variables
- Identifying outliers, missing values, or human error
- Understanding the relationship(s), or lack of, between variables
- Ultimately, maximizing your insights of a dataset and minimizing potential errors that may occur later in the process.
Key Steps of EDA
The key steps involved in conducting EDA on an automated data pipeline are:
- Data Ingestion: The automated data pipeline collects information from a variety of sources. Begin by familiarising yourself with the data sources and their properties.
- Data Profiling: Examine the data structure, data kinds, missing values, and fundamental statistics such as mean, median, and standard deviation. This stage aids in identifying any data quality issues.
- Data Visualisation: To visualise the data at various stages of the pipeline, use charts, graphs, and plots. Investigate distributions, correlations, and trends to comprehend the behaviour of the data.
- Feature Analysis: Examine the data’s features or properties to determine their significance and relevance in the analysis. This is an important step in the feature engineering and model development process.
- Outlier Detection: Look for outliers or extreme results that could impair the pipeline’s accuracy. Outliers should be addressed if necessary.
- Data Transformation and Preprocessing: Examine the transformations used in the pipeline to determine their impact on data quality and output.
- Data Validation: Ensure data integrity and consistency by validating the data against stated business rules or constraints.
- Data Distribution Over Time: Examine the data distribution over time to determine seasonality or patterns if the data pipeline includes time-series data.
- Model Evaluation (if applicable): If the data pipeline includes a predictive model, review and interpret the model’s performance to determine its correctness and efficacy.
- Documentation: During the EDA process, document the findings, insights, and any data quality concerns or anomalies observed.
Types of Exploratory Data Analysis
EDA builds a robust understanding of the data, and issues associated with either the info or process. It’s a scientific approach to getting the story of the data. There are four main types of exploratory data analysis which are listed below:
1. Univariate Non-Graphical
Let’s say you decide to purchase a new iPhone solely based on its battery size, disregarding all other considerations. You can use univariate non-graphical analysis which is the most basic type of data analysis because we only utilize one variable to gather the data. Knowing the underlying sample distribution and data and drawing conclusions about the population are the usual objectives of univariate non-graphical EDA. Additionally included in the analysis is outlier detection. The traits of population dispersal include:
Spread: Spread serves as a gauge for how far away from the Centre we should search for the information values. Two relevant measurements of spread are the variance and the quality deviation. Because the variance is the root of the variance, it is defined as the mean of the squares of the individual deviations.
Central tendency: Typical or middle values are related to the central tendency or position of the distribution. Statistics with names like mean, median, and sometimes mode are valuable indicators of central tendency; the mean is the most prevalent. The median may be preferred in cases of skewed distribution or when there is worry about outliers.
Skewness and kurtosis: The distribution’s skewness and kurtosis are two more useful univariate characteristics. When compared to a normal distribution, kurtosis and skewness are two different measures of peakedness.
2. Multivariate Non-Graphical
Think about a situation where you want to purchase a new iPhone solely based on the battery capacity and phone size. In either cross-tabulation or statistics, multivariate non-graphical EDA techniques are frequently used to illustrate the relationship between two or more variables.
An expansion of tabulation known as cross-tabulation is very helpful for categorical data. By creating a two-way table with column headings that correspond to the amount of one variable and row headings that correspond to the amount of the opposing two variables, a cross-tabulation is preferred for two variables. All subjects that share an analogous pair of levels are then included in the counts.
For each categorical variable and one quantitative variable, we create statistics for quantitative variables separately for every level of the specific variable then compare the statistics across the amount of categorical variable.
It is possible that comparing medians is a robust version of one-way ANOVA, whereas comparing means is a quick version of ANOVA.
3. Univariate Graphical
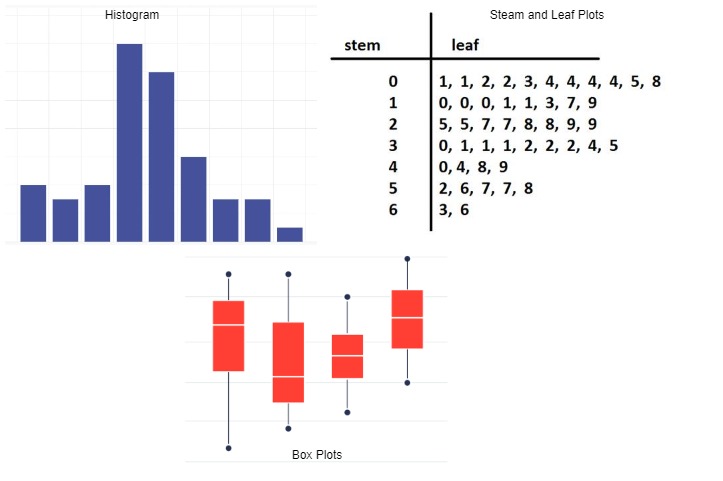
Different Univariate Graphics
Imagine that you only want to know the latest iPhone’s speed based on its CPU benchmark results before you decide to purchase it. Since graphical approaches demand some level of subjective interpretation in addition to being quantitative and objective, they are utilized more frequently than non-graphical methods because they can provide a comprehensive picture of the facts. Some common sorts of univariate graphics are:
Boxplots: Boxplots are excellent for displaying data on central tendency, showing reliable measures of location and spread, as well as information on symmetry and outliers, but they can be deceptive when it comes to multimodality. The type of side-by-side boxplots is among the simplest applications for boxplots.
Histogram: A histogram, which can be a barplot where each bar reflects the frequency (count) or proportion (count/total count) of cases for various values, is the most fundamental type of graph. One of the simplest ways to immediately understand your data’s central tendency, spread, modality, shape, and outliers is by using histograms.
Stem-and-leaf plots: An easy substitute for a histogram may be stem-and-leaf plots. It shows all data values and therefore the shape of the distribution.
4. Multivariate Graphical
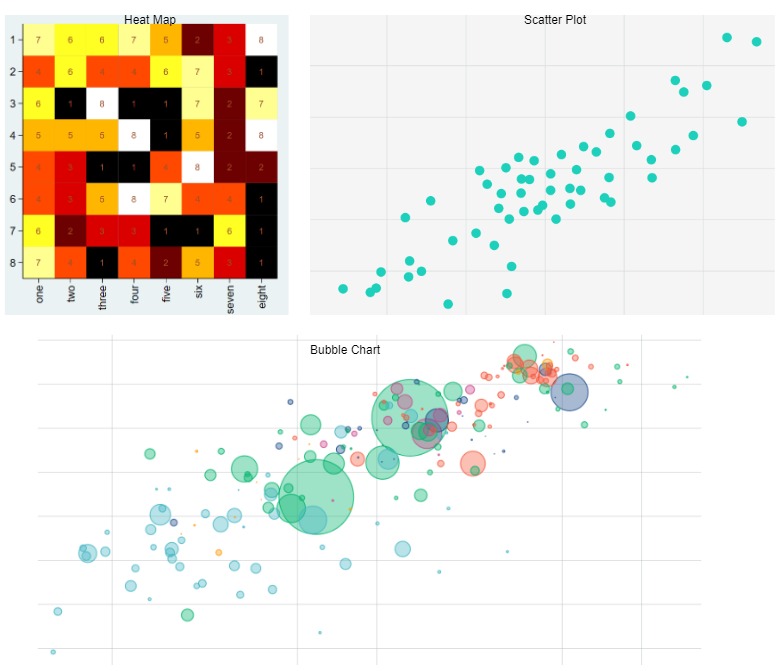
Different Multivariate Graphics
Assume you decide to purchase the new iPhone based on its CPU benchmark and UX score to determine how optimized the device is in comparison to its predecessors. The links between two or more sets of knowledge are displayed graphically in multivariate graphical data. The one that is most frequently used is a grouped bar plot, where each group represents one level of one of the variables and each bar inside a gaggle represents the amount of the other variable. Some common sorts of multivariate graphics are:
Heat Map: A heat map is a graphical representation of data where values are represented as colors. It is used to visualize and understand patterns, trends, and variations in data across different categories or dimensions.
Scatter Plot: A scatter plot is a type of data visualization that displays the relationship between two numerical variables. It uses Cartesian coordinates, where each data point is represented by a dot or marker on the plot.
Bubble chart: A bubble chart is a type of data visualization that extends the concept of a scatter plot by adding a third variable. It represents data points as bubbles, where the size of each bubble is determined by the value of the third variable.
Exploratory Data Analysis Tools
There are many exploratory data analysis tools available in the market, however, some of the most popular tools which our consultants mostly use are:
- Python: Python is a high-level, general-purpose programming language that is known for its simplicity, readability, and versatility. It is an interpreted, object-oriented programming language with dynamic semantics which is a great fit for data pipeline. Some of the most popular Python libraries for EDA are NumPy, Pandas, Matplotlib, Seaborn, Plotly, Scipy, DataPrep, etc.
- R: R is a programming language and open-source software environment specifically designed for statistical computing and graphics. It is widely used among statisticians in developing statistical observations and data analysis. Some of the most popular R libraries for EDA are ggplot2, dplyr, tidyr, corrplot, psych, ggvis etc.
- Tableau: Tableau can be used as an EDA tool when a data pipeline is not necessary. It has by default functions to create visualization for Exploratory Data Analysis. In addition, it is possible to add custom Python and R scripts to do complex analysis.
- Jupyter Notebook: Jupyter Notebook is an excellent tool for conducting EDA due to its interactive nature and support for data visualization. It has both Python and R script execution options which made this tool dynamic.
- Databricks: Databricks is a popular cloud-based platform that is designed to handle big data. This tool can be used when the dataset is big and requires memory to process data. It is an interactive tool for Exploratory Data Analysis due to its high processing power and scalability.
Conclusion
In conclusion, Exploratory Data Analysis (EDA) is an invaluable tool for understanding and uncovering insights from raw data.
Here at TL Consulting, our data consultants are experts at using Exploratory Data Analysis (EDA) techniques to systematically explore and understand underlying trends and patterns, improved understanding of variables, and better preprocess data to save time and enable our clients to make decisions with better confidence. TL Consulting provides end-to-end DataOps pipeline services using advanced ML/AI techniques in the data analytics & engineering domain and has helped many organizations to achieve their digital transformation goals through better data-driven business understanding.
Visit TL Consulting’s data-engineering page to learn more about our service capabilities and send us an enquiry if you’d like to learn more about how our dedicated consultants can help you.